JWST Predictions for z > 10 Galaxies from the Renaissance Simulations: Photometry and Sizes
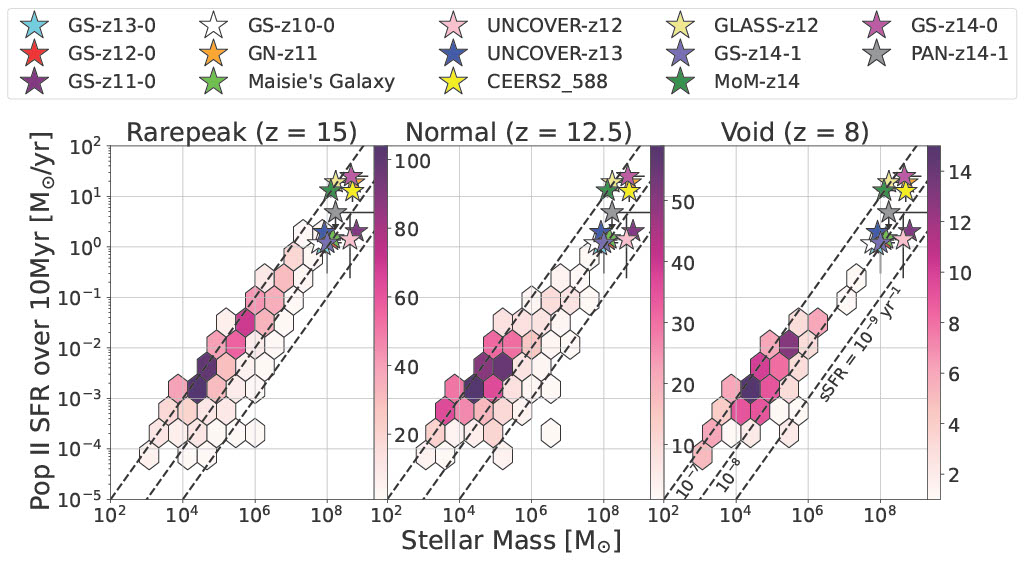
Pop II Star Formation Rate over 10Myr vs Stellar Mass
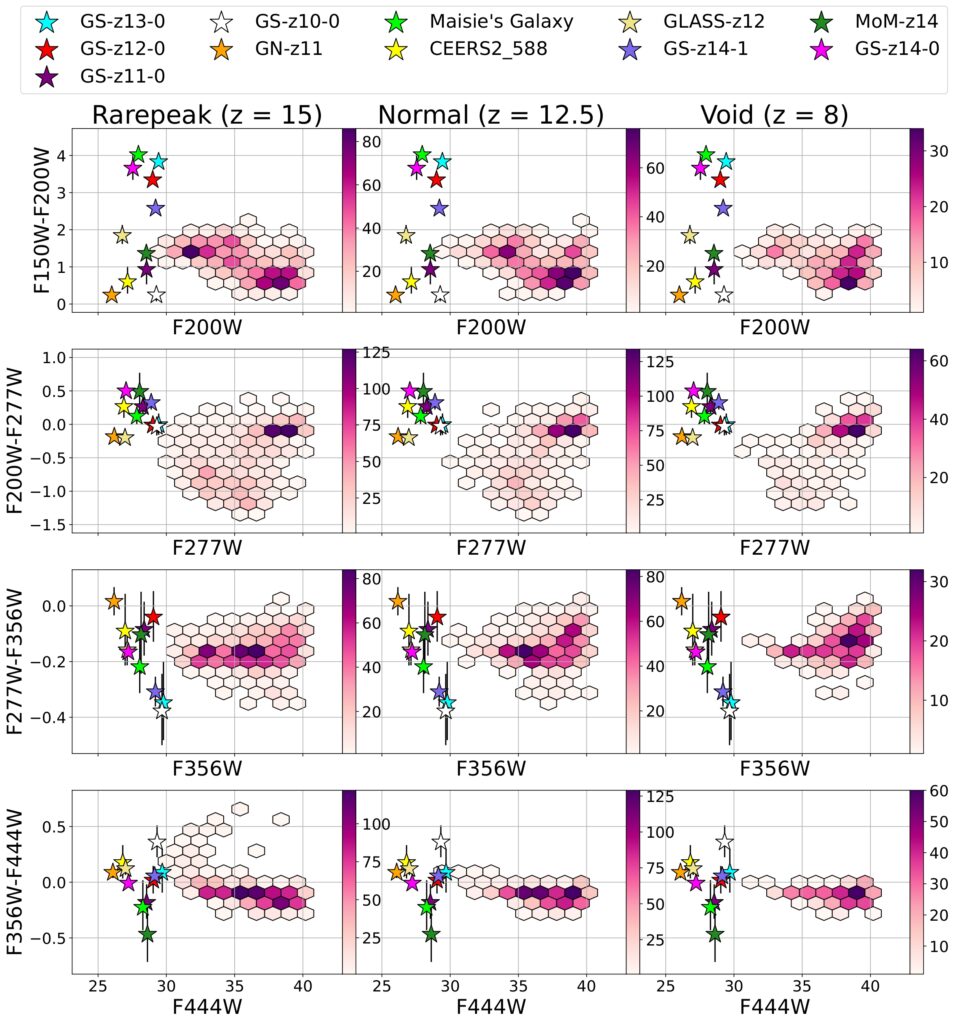
Population II Star Formation Rates (SFR) within galaxies in the Rarepeak, Normal, or Void regions of Renaissance
Plots SFR (y-axis) against stellar mass (x-axis)
Red hexbin color represents number of galaxies (scatter plot approximated by hexbins)
Star shapes represent the z > 10 JWST spectroscopically confirmed galaxies
Dashed lines show specific star formation rate (sSFRs) overlap Renaissance data and JWST observed data
Galaxy Number per Region vs Stellar Mass
Number of galaxies in each region, Rarepeak, Normal, Void
Galaxy number is a function of stellar mass and half stellar radius
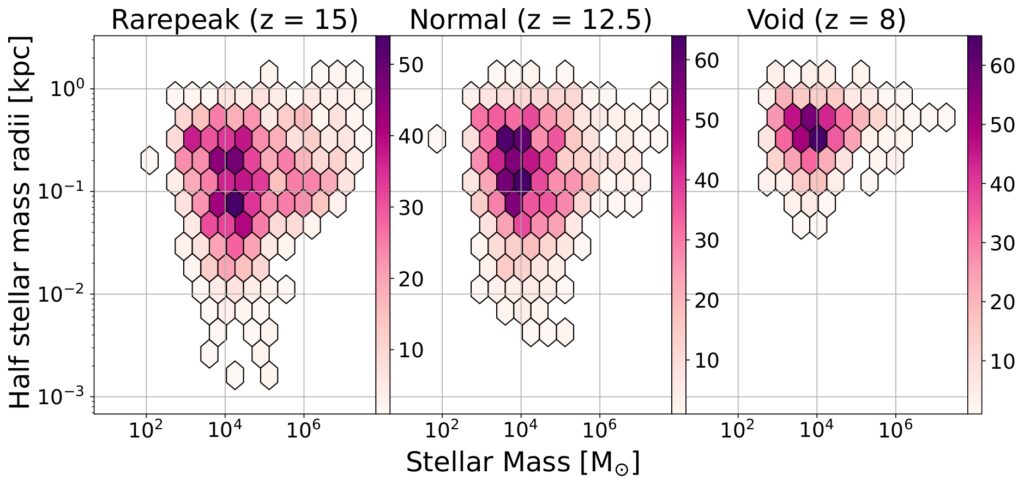
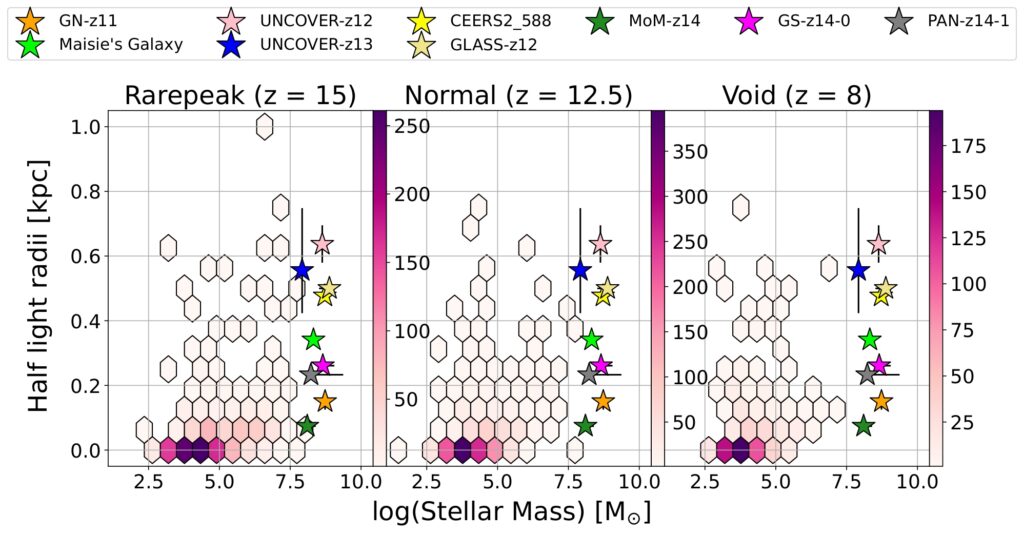
Half Light Radii vs Stellar Mass
The half light radii of the Renaissance Simulations
Half light radii (the radius containing half the galaxy’s light) as a function of stellar mass
Hexbins indicate the number of galaxies
Stars represent the z > 10 JWST spectroscopically confirmed galaxies
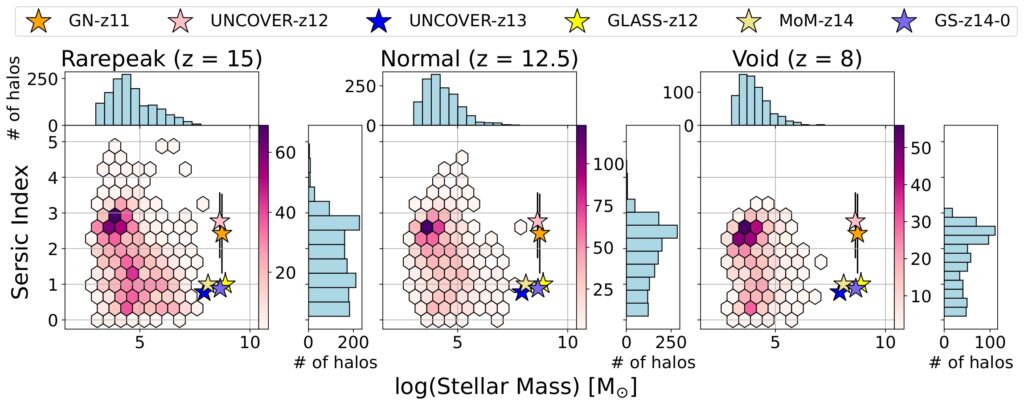
Sersic Index vs Stellar Mass
Sersic index as funtion of stellar mass for the F200W filter
Three panels represent regions Rarepeak, Normal and Void
hexbins represent number of galaxies
x-axis shows logarithm of stellar mass
y-axis shows the Sersic index, which describes the concentration of the galaxy’s light
histogram details how many halos correspond with each stellar mass
peak of histogram shows most Renaissance galaxies are low mass
stars represent spectroscopically confirmed JWST galaxies with z > 10
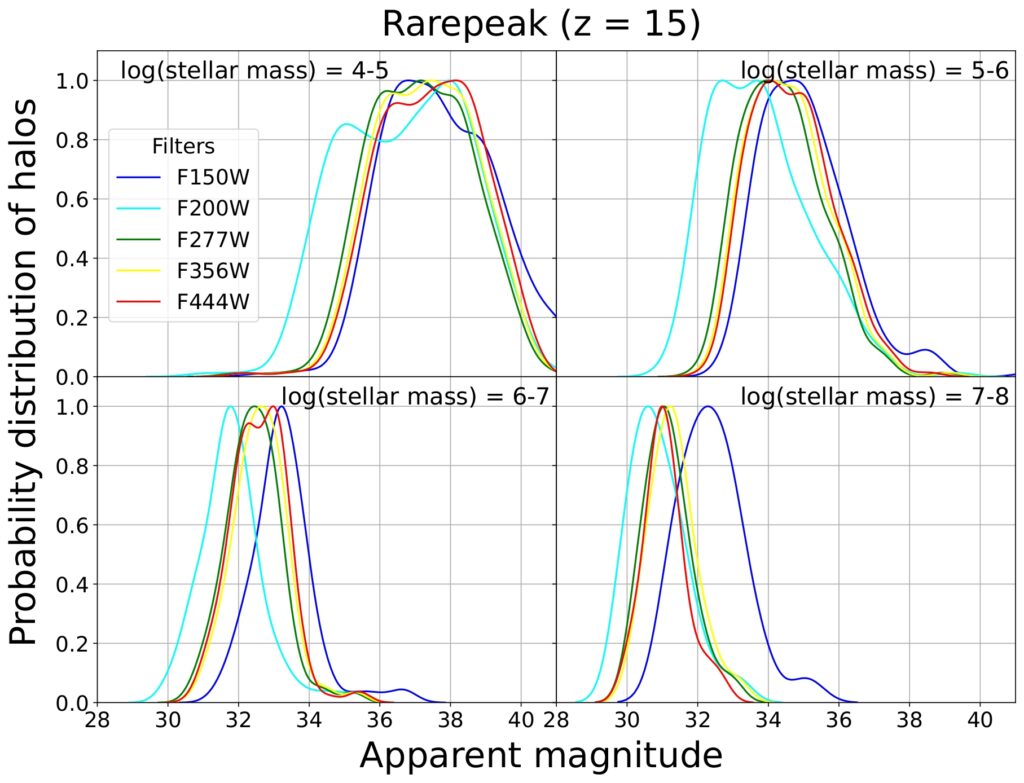
Probability Distribution of the Apparent Magnitude of Halos in the Renaissance Simulations over Stellar Mass at z = 15
Figure displays probability distribution of apparent magnitudes for galaxies in the Rarepeak region of the Renaissance Simulations at z = 15
Each panel shows different stellar mass range
x-axis is apparent magnitude
y-axis is probability distribution of halos
Each color curve represents different JWST wideband filters
Tables display that as stellar mass increases, the magnitude distribution shift towards lower apparent magnitudes, indicating that higher mass galaxies are brighter
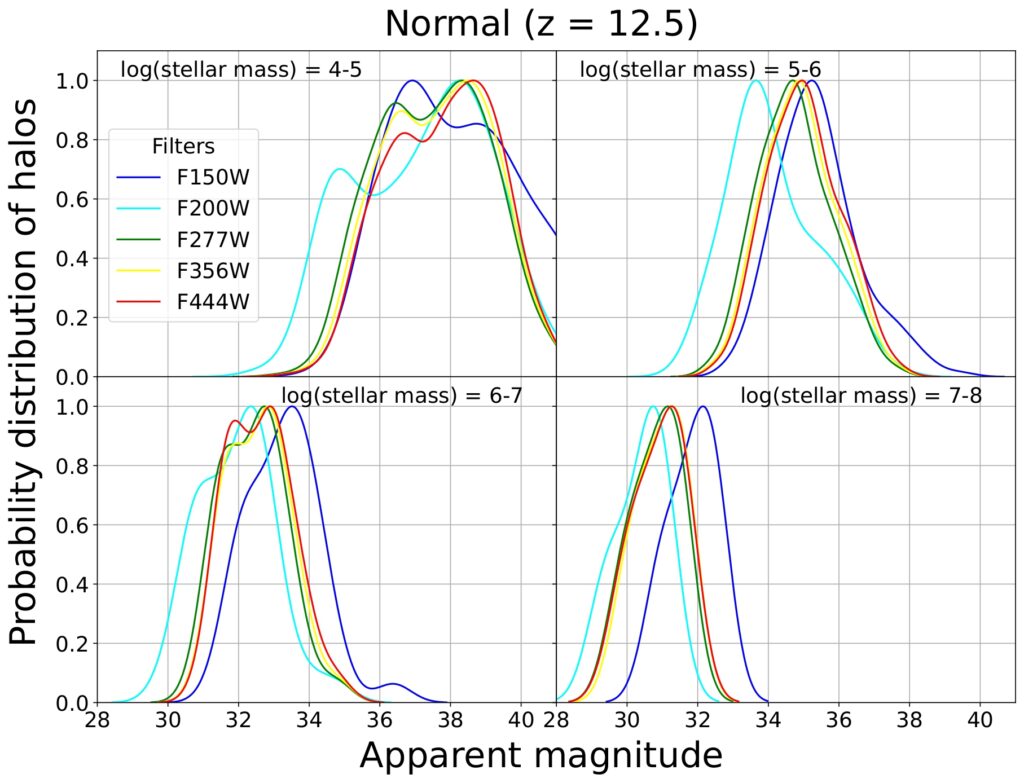
Probability Distribution of the Apparent Magnitude of Halos in the Renaissance Simulations over Stellar Mass at z = 12.5
Figure displays probability distribution of apparent magnitudes for galaxies in the Normal region of the Renaissance Simulations at z = 12.5
Each panel shows different stellar mass range
x-axis is apparent magnitude
y-axis is probability distribution of halos
Each color curve represents different JWST wideband filters
Tables display that as stellar mass increases, the magnitude distribution shift towards lower apparent magnitudes, indicating that higher mass galaxies are brighter
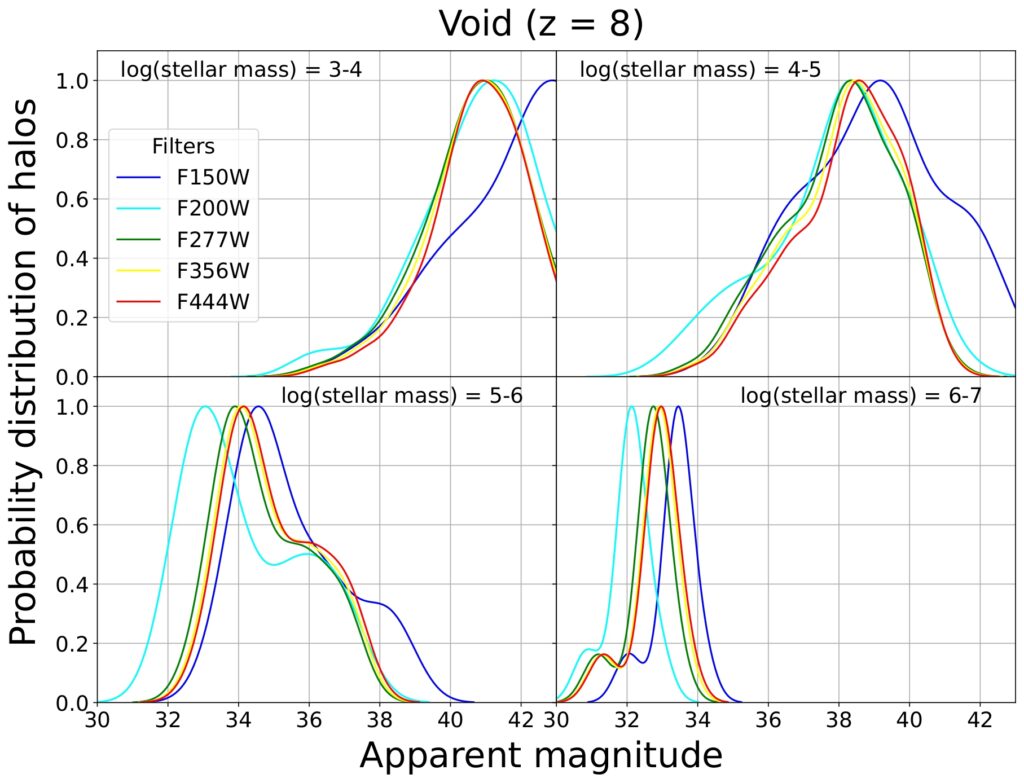
Probability Distribution of the Apparent Magnitude of Halos in the Renaissance Simulations over Stellar Mass at z = 8
Figure displays probability distribution of apparent magnitudes for galaxies in the Void region of the Renaissance Simulations at z = 8
Each panel shows different stellar mass range
x-axis is apparent magnitude
y-axis is probability distribution of halos
Each color curve represents different JWST wideband filters
Tables display that as stellar mass increases, the magnitude distribution shift towards lower apparent magnitudes, indicating that higher mass galaxies are brighter
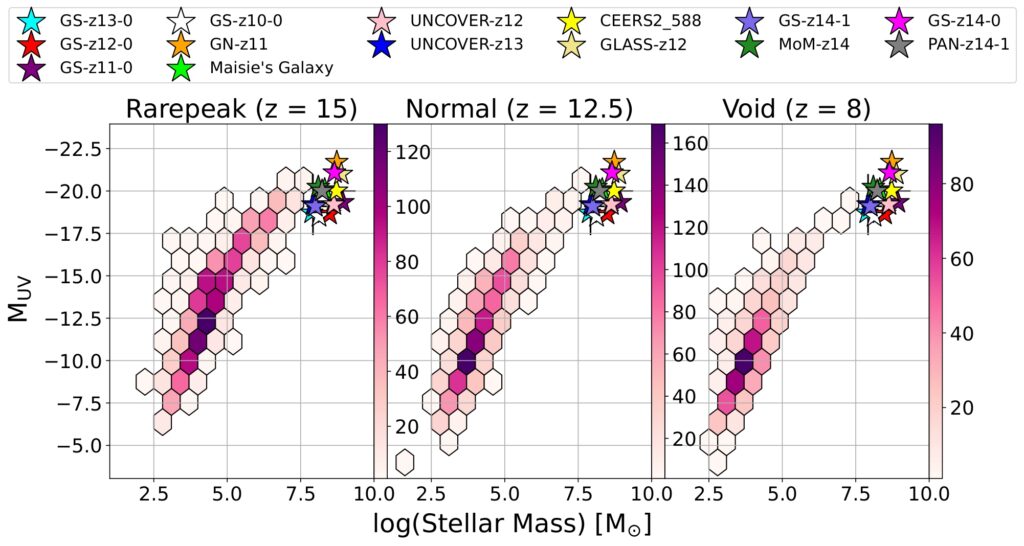
Absolute UV Magnitude vs Stellar Mass
Absolute UV magnitude as a function of stellar mass
Hexbins represent galaxy number
Each panel represents region, Rarepeak, Normal, Void
x-axis shows logarithm of stellar mass
y-axis shows absolute UV magnitude
UV magnitude values were calculated from synthetic observations generated from 100 different viewing angles, value plotted for each galaxy is the average magnitude across all viewing angles
Colored stars represent spectroscopically confirmed JWST galaxies with z > 10